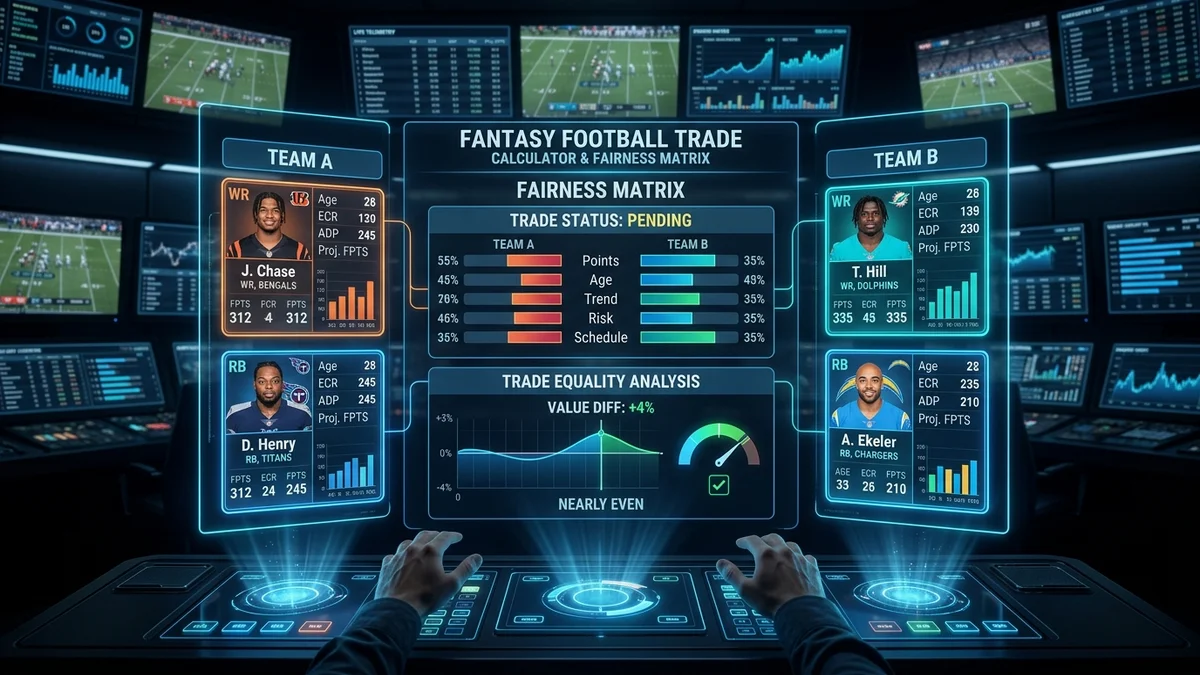
The Mathematics of Bilateral Trades: Why Roster Spots Are Not Free
Most amateur fantasy football trade calculators commit a fatal mathematical error: they treat player valuations as additive scalar numbers. Under naive scoring models, if Player A is assigned a value of 50 points, a trade of Player B (30 points) plus Player C (25 points) is treated as a win for the manager receiving B and C (55 vs. 50).
In competitive fantasy leagues, this conclusion is disastrously incorrect. Fantasy lineups feature finite starting constraints—typically 1 QB, 2 RBs, 2 or 3 WRs, 1 TE, and 1 or 2 Flex spots. When a manager executes a 2-for-1 trade receiving two players, they must release an existing player from their bench to create roster space. The true equation is never Player A vs. Player B + Player C; the actual mathematical transaction is:
Because the dropped bench asset carries positive replacement equity (especially early in the season), the manager giving up the lone superstar incurs an immediate hidden loss unless the incoming multi-player package provides an overwhelming surplus.
Receiving multiple players forces roster cuts, penalizing the receiving side by the cut player's VORP.
Tier-1 alpha superstars demand a mathematical premium because weekly ceiling cannot be duplicated.
Draft capital appreciates steadily into April while veteran assets incur in-season injury risks.
The Stud Consolidation Tax: Empirical 15% to 20% Alpha Premium
To prevent exploitative 2-for-1 trades, our engine enforces the Stud Consolidation Tax. When calculating the aggregate value of a multi-asset package, the highest-rated asset is credited at 100% value. Subsequent assets in the same package are discounted by 20% in Redraft formats (and 15% in Dynasty formats) to reflect the finite roster spot penalty.
Ideal in shallow 10-team leagues where waiver depth is abundant and weekly elite ceiling crowns champions.
Optimal in deep 14-team or 16-team formats where waiver wires are barren and injury insulation is critical.
Consider trading an elite tier-one wide receiver like Justin Jefferson (94 Trade Value) for two solid WR2/RB2 starters rated at 52 and 48 points. Under our engine:
- Side A (Solo Alpha): 94.0 Total Value Pts
- Side B (2-Player Depth): 52.0 + (48.0 × 0.80) = 52.0 + 38.4 = 90.4 Total Value Pts
- Fairness Verdict: Slight Edge to Side A (+4.0%). The package is fair, but Side A captures optimal weekly ceiling.
Dynasty vs. Redraft Valuation: Age Cliffs and Rookie Pick Longevity
Trading in Dynasty leagues introduces multi-year asset depreciation that does not exist in standard seasonal redraft formats. Running backs experience sharp efficiency cliffs starting at age 26.8, whereas wide receivers sustain elite WR1 scoring through age 29.4 before gradual decline.
Furthermore, future rookie draft picks never pull a hamstring, never tear an ACL, and do not suffer from offensive coordinator coaching changes. Over a 10-year NFL draft sample size, rookie picks reliably appreciate in liquidity between November and the upcoming April NFL Draft:
Negotiation Psychology: Crafting Counter-Offers That Get Accepted
Sending a trade offer that is severely skewed in your favor (e.g. +35% value win) rarely leads to acceptance; instead, it insults your trade partner and closes communication channels. Successful fantasy traders operate on win-win structural imbalances:
Identify what your partner needs using our Sleeper League Sync tool. If they are desperate for running back help, packaging a surplus RB2 for a struggling buy-low WR1 delivers positive perceived utility to both squads while securing you long-term mathematical advantage.
Frequently Asked Questions
Strategic guidance on fantasy football trades and valuation math
01 What is the Stud Consolidation Tax in 2-for-1 fantasy trades?
Starting lineups in fantasy football have strict roster limits (typically 9 to 10 starters). Combining two 12.0 PPG players does not equal one 18.0 PPG superstar plus replacement level (9.0 PPG), which nets 27.0 PPG. Because the manager giving up the superstar must also take on an additional roster spot and drop a bench player, the multi-player package must provide a 15% to 20% value surplus to be considered mathematically fair.
02 How does the trade analyzer value future rookie draft picks?
In Dynasty mode, rookie draft picks are valued via empirical draft capital survival curves. Historically, Early 1st round picks (1.01–1.04) carry a 68% probability of achieving multiple top-12 positional finishes, warranting a top-tier asset rating (82 pts). Later picks depreciate based on historical hit-rate decay (Mid 1st: 65 pts, Late 1st: 48 pts, 2nd Round: 30 pts).
03 When should I sell high on an overperforming player?
Sell high when a player's fantasy scoring outpaces their underlying peripheral metrics—specifically Expected Fantasy Points (xFP), red-zone target share, and route participation. If a wide receiver scores 4 touchdowns on only 12 targets, touchdown regression is mathematically imminent.
04 Can I share a proposed trade evaluation with my league-mate?
Yes. Every selected player and draft pick synchronizes dynamically into the browser URL query parameters. Tapping 'Copy Trade Proposal to Clipboard' copies a formatted summary that you can paste directly into Sleeper chat, Discord, or SMS text messages.